
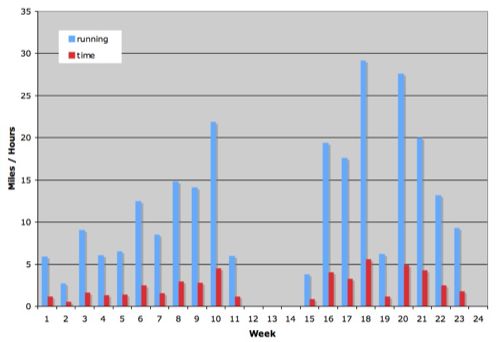
Just because I am nuts about numbers and data, here is a graphical representation of my training, totalling the miles done per week in bar chart format (generated in my Excel spreadsheet, exported as PDF, converted to an image).
last updated:
Jan 10, 2008 10:01 am
just to let you know, i have completely ripped off this idea for my own running blog. it really helps to have a visual representation of what all those footfalls on the pavement actually adds up to.